It is one thing to know the price a chemical is currently valued in the market, a service that ResourceWise company Tecnon OrbiChem has provided for almost half a century.
But when it comes to understanding how chemicals are bought and sold internationally, trade statistics are a vital source of information. Wading through Excel spreadsheets and countless pages of numbers and digits is such a mind-numbing exercise though. That's why we built – and why we continually improve – a cloud-based software tool that presents reported trade flows in graphical and infographic form.
Our chemicals data intelligence platform OrbiChem360 leverages petrochemicals, fibers, plastics, renewable carbon, and chlor-alkali sector insight spanning six decades.
From that vantage point, the platform's visualizations and infographics illustrate worldwide trade flows in an instant.
OrbiChem360 also continually sources trade dataset updates from Global Trade Tracker – said to cover 99% of the world – analyzing and sharing its insight in real-time. Each week, OrbiChem360 servers convert 30,000-plus data points to user-friendly interactive visuals that are accessible 24/7.
Color-Coded Chemicals and Commodities
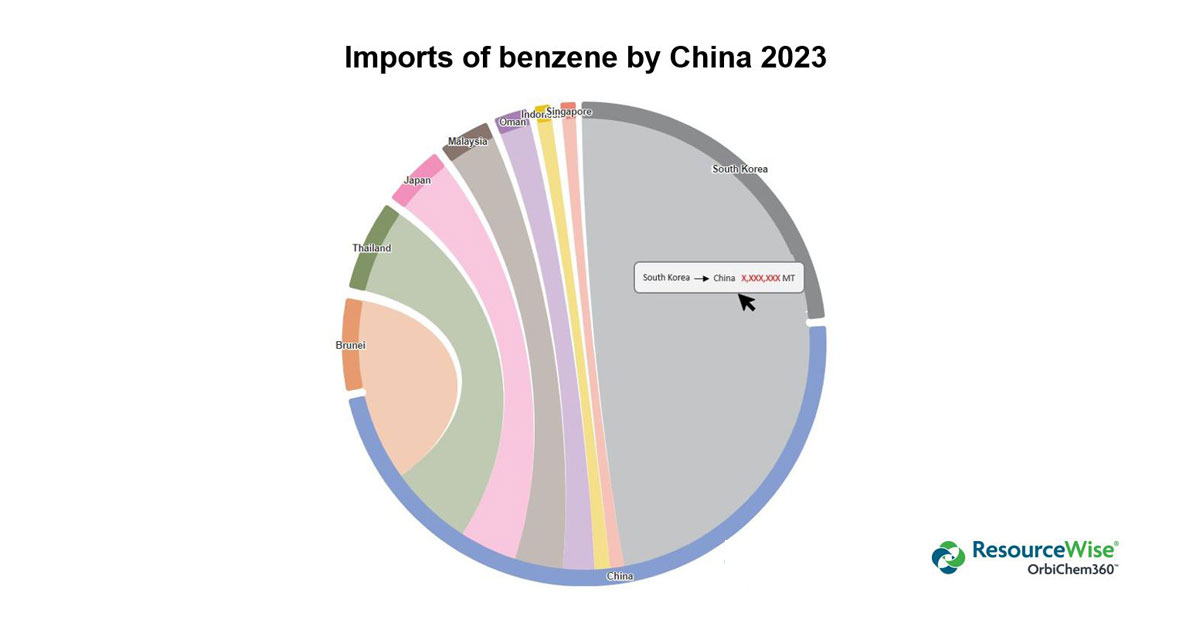
To optimize global insights, the outputs and inputs of countries or regions are divided up and color-coded in pie chart-like visuals. The example below shows several of the countries – though not all – in which China’s pre-November 2023 benzene imports originated. Charts like these can be toggled to show more – or less – data depending on user preference.
Hovering a cursor over the graph triggers a pop-up showing the respective import volume in metric tons. As the graph shows, China has imported over a million metric tons of benzene from its neighbor South Korea so far this year. The figures indicated by X in the image are available to OrbiChem360 subscribers only.

Source: Tecnon OrbiChem
Using the platform's Trade dashboard, subscribers select one of the 100-plus chemicals we monitor to reveal insight on a monthly or annual basis.
Trade data is reported with increasing efficiency. Not only are virtually all countries now included, but some countries also report as rapidly as within five weeks.
And since OrbiChem360 servers refresh each dashboard when new data becomes available, its insights are as up-to-date as can be.
Visual and Conceptual Insight
Our market analysts and software engineers work closely to create, maintain, and optimize this valuable chemical data as a service (DaaS) tool.
"We remain mindful that the way that information is designed will largely dictate how audiences relate to it," comments Tecnon OrbiChem's lead business manager William Bann.
The human brain is better equipped to grasp information communicated using illustrative techniques.
William Bann, Tecnon OrbiChem Lead Business Manager
And while the technology transmitting the information within our platform relies on recurrent lines of numbers, binary, and coding, the human brain benefits from more illustrative communication techniques, Bann adds.
Customizing Data Capture
"OrbiChem360's dashboard customization tools are designed to improve supply chain visibility, expose hidden trade movements, and enhance user experience."
"For example," continues Bann. "Subscribers can drill down into trade flows that have occurred within any of the world’s eight major regions, country by country."
"Where the focus is on a single country, it is possible to change the trade flow scope at the click of a mouse. This switches the perspective from an import to an export view for the product or chemical."
"The degree of detail available at country level, switching between chemical flows into one country – or out of other countries within a region – brings visibility to traditionally hidden chemical product flows," Bann adds.
OrbiChem360's trade flow toolset improves supply chain visibility, exposes hidden trade movements and enhances user experience.
William Bann
Circumvent 'Commercial Sensitivity' Censorship
Sometimes, commercial sensitivity surrounds a country’s export and/or import volumes for a particular chemical. In these instances, reporting countries might suppress import or export data entirely, or partially.
It can happen when a country’s producers are limited to just one or two separate entities. Publicizing these companies' export data potentially discloses too much intelligence on the domestic competitor’s business. For this reason, governments are inclined to respond favorably to a data suppression request by either, or both parties.
Italian cyclohexanone is a typical example. Since there is just one producer in Italy and only a handful in Europe as a whole, Italy does not publish cyclohexanone exports.
However, OrbiChem360's Mirror Trade Flow tool presents Italian cyclohexanone imports as reported by the receiving countries. In this way, the suppressed trade flows are laid bare (though care is needed in analyzing them).
"Similarly, when it comes to import volumes, records may be suppressed when a country’s buyers are limited to one or two," Bann adds.
"So, in addition to more granular geographical detail, OrbiChem360 brings visibility to vital trade movements that may otherwise remain unknown due to suppression by the importer – or exporter – country’s government."
Revealing Russian Exports
An unusually wide suppression of both imports and export data related to Russia (and Belarus) followed Putin's invasion of Ukraine last year. Traditionally, Russia was a large exporter of phenol, for example.
Russian export statistics stopped after January 2022. However, using the Mirror Trade Flow tool in OrbiChem360, the imports of Russian goods recorded by receiving countries continue to reflect statistics that Russia is no longer self-reporting.
As the graph below shows, Russia's phenol trade steadily fell away in the months following the invasion. Mirrored Trade Flows out of Russia from August 2022 onwards show Turkey as the only country that continued receiving Russian phenol in 2022. 2023 however brought new trade flows from Russia with other nations including India, Brazil, and China importing Russia's phenol.
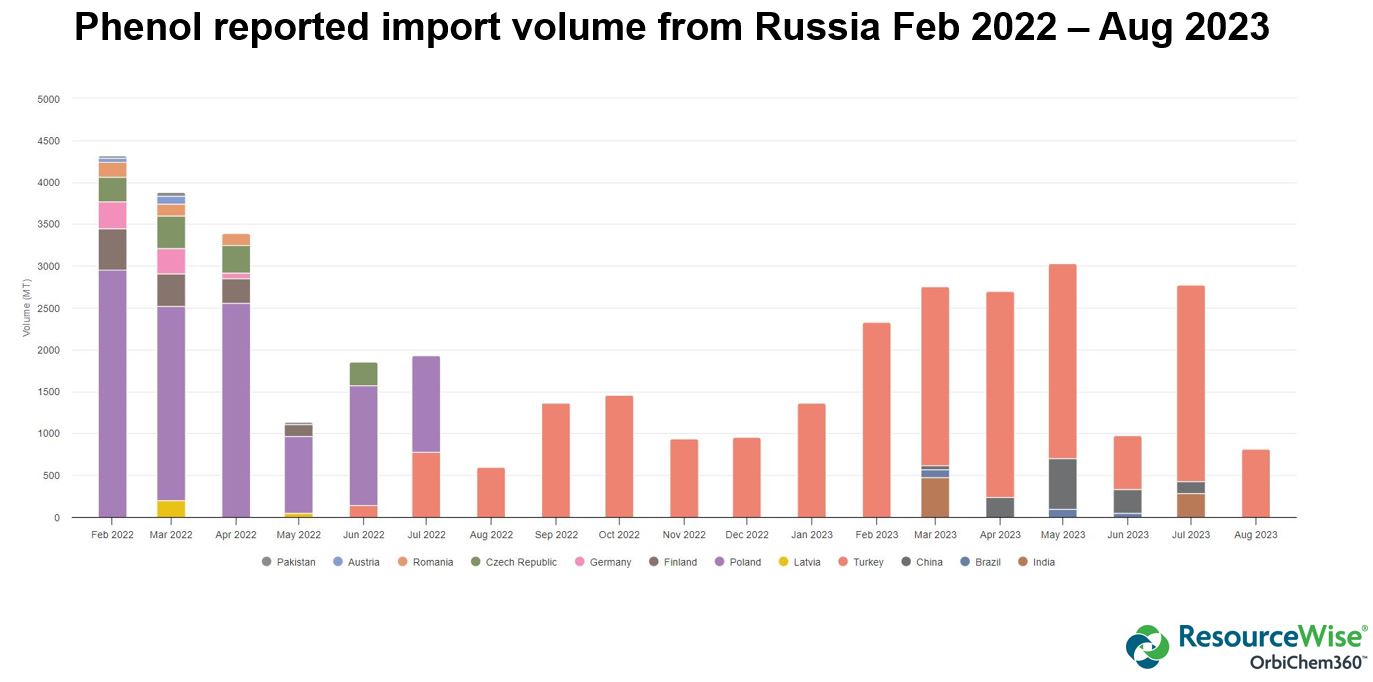
Source: Tecnon OrbiChem
End Market Visibility
OrbiChem360 also allows its subscribers to determine a product’s final country of distribution, a dynamic that overrides skewed raw data feeds.
"It isn't uncommon for the end destination for chemicals supplies – following large volume re-allocation into smaller cargoes at trans-shipment hubs like the ports of Rotterdam, Pusan, and Singapore – to remain largely obscured," Bann explains.
The benefit of an OrbiChem360 subscription is that blurred and distorted representations of data can be unraveled to paint a more accurate picture of global supply and demand.
Request a demo of the platform to learn how we can help your business succeed in the global chemicals industry.

Submit the form below to receive updates on chemicals of interest to you.


10 Essential Steps for Navigating the Methanol Market