Chemicals markets are in disarray with the lack of clarity preventing buyers from committing to volumes, whether short or long-term. Demand is expected to maintain its downward trajectory throughout Q4 and into Q1 2023. Chemicals consumers are aware that long positions in the market can quickly turn to very short if the Chinese market wakes from its current dormant state.
Buyers face an unenviable conundrum: do they pay a premium price for domestic material to ensure a secure source of stable supply, or should they pay much less for Asian material to maintain a competitive edge but risk putting themselves in a precarious position?
While Tecnon OrbiChem does not have the answer, our price forecasting service improves insight in today’s unpredictable environment.
Tecnon OrbiChem has published price forecasts on a monthly basis for the past five years. We developed this multi-client service following many years' experience providing specifically requested price forecasts. Our ChemForesight service meets chemical industry buyers, sellers and market strategists' need for insight into the long-term repercussions of market-shaping factors, even those newly emerging.
ChemForesight is effectively a crystal ball on the future –
and who doesn’t need that in these tumultuous times?
Matteo Baldi, Tecnon OrbiChem's Global Sales Manager
 Global sales manager Matteo Baldi regularly demonstrates our proprietary price forecasting service to current subscribers of our chemicals data platform OrbiChem360.
'Supply chain visibility is vital to business success, especially as volatile energy markets impact chemicals availabilities and pricing. OrbiChem360 subscribers ask how they can leverage the platform's datasets to better understand market dynamics and make realistic projections.
'To our customers, our monthly ChemForesight service is effectively a crystal ball on the future. And who doesn’t need that in these tumultuous times?
'A great deal of technical expertise, decades of chemical markets insight and a rare grasp of the petrochemicals sector’s complex inter-connectivity underpin ChemForesight. If yours is one of the 40 or so chemicals it covers, you should get in touch for a demonstration,' Baldi adds.
Price trends turn frequently
ChemForesight is published each month. Experience tells us that chemical price trends can turn within a matter of days as a result of oil price rises or slides, unexpected plant downtime, extreme weather conditions (for example hurricanes), company announcements, disruptions to the supply chain and so on. We therefore generate forecasts that are always no more that a few weeks old.
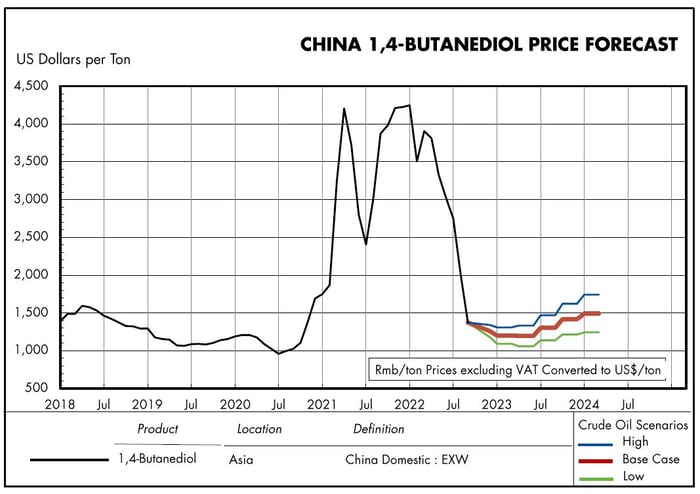
Forecasts are presented for three energy cases, which are benchmarked to three crude oil scenarios. This enables the user to choose which scenario is preferred, or to interpolate between the three versions offered. The graph above shows this for the chemical 1,4-Butanediol used as a solvent and for manufacturing plastics, elastic fibres and polyurethanes. Each month we modify the scenarios so that the base case represents the most likely outlook at the time, while the 'High' and 'Low' cases allow for possible changes in the oil markets, or other energy sources, in the following weeks.
The three different crude oil scenarios allow the user to judge the effect of deviations from the base predictions. Feedstock and energy costs are indexed to the Brent crude oil price, with adjustments as necessary for non-petroleum sources (mainly natural gas and coal, in some cases electricity too). The other major influence allowed for is the market balance. Our extensive databases on supply and demand, together with up-to-date industry input, help us to judge average plant utilisation rates, which are a fundamental input to our forecasting technique.
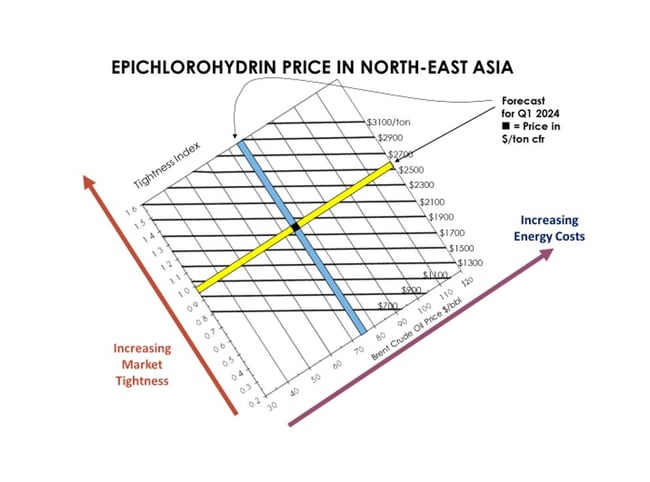
We allow for the effects of the supply-demand balance, as measured by the 'Tightness Index' (TI), on the margins achieved in the market. As the buffer between production capacity and market demand narrows, prices get driven higher. This is allowed for in the forecasting methodology by applying the TI for the market in question at the time chosen for the forecast. [The TI is the reciprocal of the buffer, as a fraction of the capacity, expressed on a logarithmic scale.]
The graphic above illustrates how this has been applied to give a price forecast for epichlorohydrin – a key epoxy resin feedstock. The blue bar has been placed at the position for the expected crude oil price, while the yellow bar has been placed at the forecast TI value. The intersection, shown by the black box, indicates the price forecast, in this case for Q1 2024.
Recently, energy costs have become especially relevant,
particularly in Europe
The service is updated every month for over 40 chemical products, in each case for the US, European and northeast Asian markets. Each ChemForesight includes a brief commentary on our medium-term expectations.
The graph above has been constructed allowing for the sensitivity of each of the raw materials (propylene, chlorine, caustic soda) to the twin effects of feedstock/energy costs, indexed to crude oil, and the supply-demand balance, as characterised by the Tightness Index.
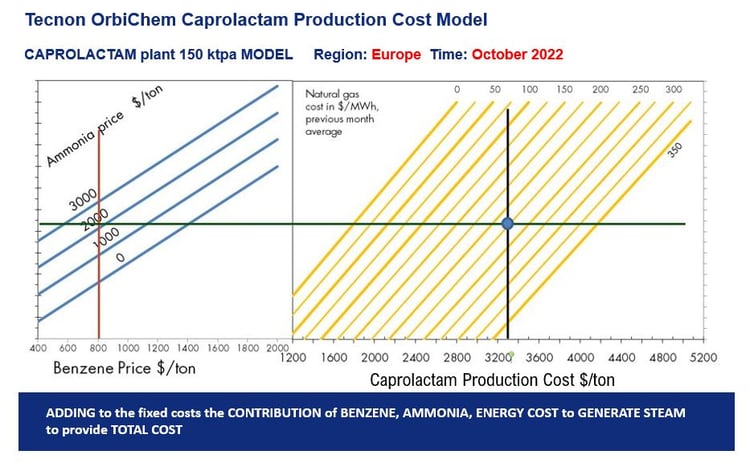
Recently, energy costs have become especially relevant, particularly in Europe. Some of our forecasts involve further analysis of energy costs. We use as an example caprolactam, which has high energy consumption during the multi-stage conversion of benzene to caprolactam. The following graph illustrates the sensitivity of the production costs of caprolactam to the energy cost, in this case the cost of natural gas in Europe, as monitored by the TTF quotations in the Netherlands.
 Source: Tecnon OrbiChem
Tangible factors versus supply/demand
In summary, Tecnon OrbiChem's price forecasts are grounded on the one hand on analysis of the tangible factors of energy/feedstock costs, and on the other hand on the supply-demand balance, which, for the most part, act independently of each other and can be assessed separately.
In the coming weeks, our global team of consultants will share insight from the current ChemForesight via this blog. To ensure you do not miss out on this valuable intelligence, fill in the form below.
Alternatively, to find out more about how a ChemForesight subscription and access to Tecnon OrbiChem's chemical industry data platform OrbiChem360 can unravel supply chains relevant to your business, email us at info@orbichem.com.