Everything is uncertain and challenges abound for individuals, industries and society at large in the context of today’s COVID-19 pandemic. Restrictions on mobility and reduced end-use consumption have created a cascade of effects on industry that ultimately manifest itself in the chemical and petrochemical markets.
PET resin demand has temporarily improved in all countries and regions due to the increased consumption of bottled water, food packaging, and sanitary and disinfectant products, amid concerns over availability and stockpiling due to the COVID-19 outbreak.
However, PET resin is not the largest application worldwide for its main raw materials and intermediates. The collateral effect on refineries, crackers and operating rates at chemical sites will differ in each region. Understanding the particular set of dynamics in each case, being flexible and being able to make the right decisions is essential to optimising the performance of any company in this complex scenario.
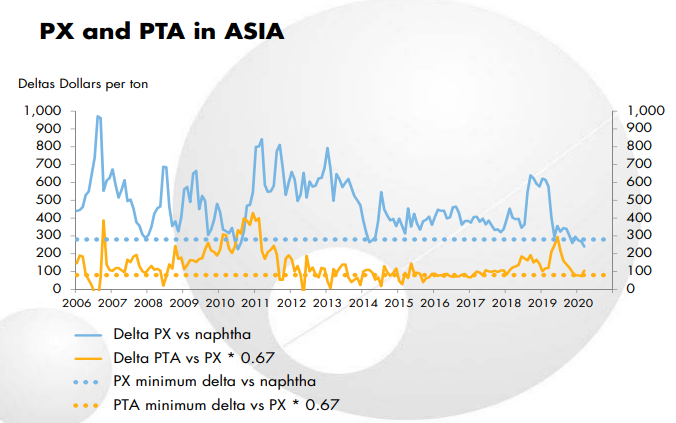
The figures represent the deltas in Asia for each of the main products in the polyester chain over the value of the respective raw materials. For PX and PTA, the solid lines show historical values since 2006, while the dotted lines show the minimum delta for both based on historical data, as well as industry standards regarding economics.
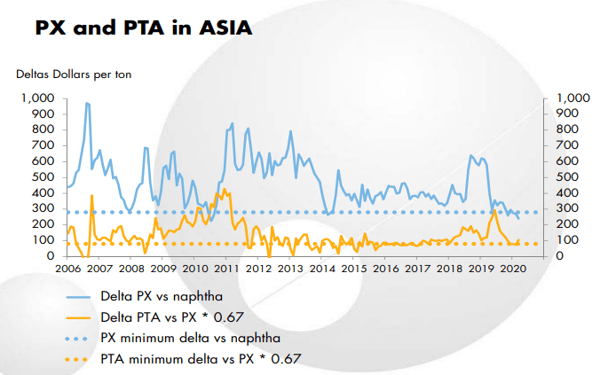
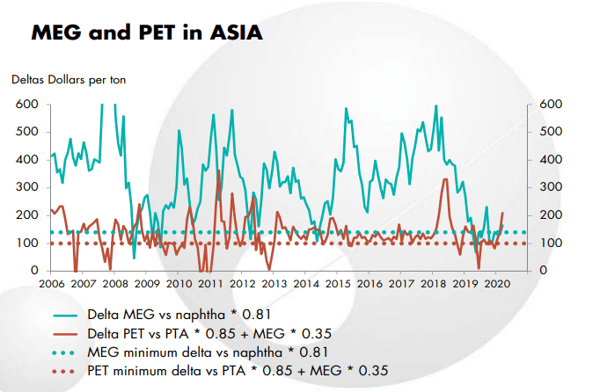
For MEG and PET, the solid lines show historical values since 2006, while the dotted lines show the minimum delta for both based on historical data, as well as industry standards regarding economics.